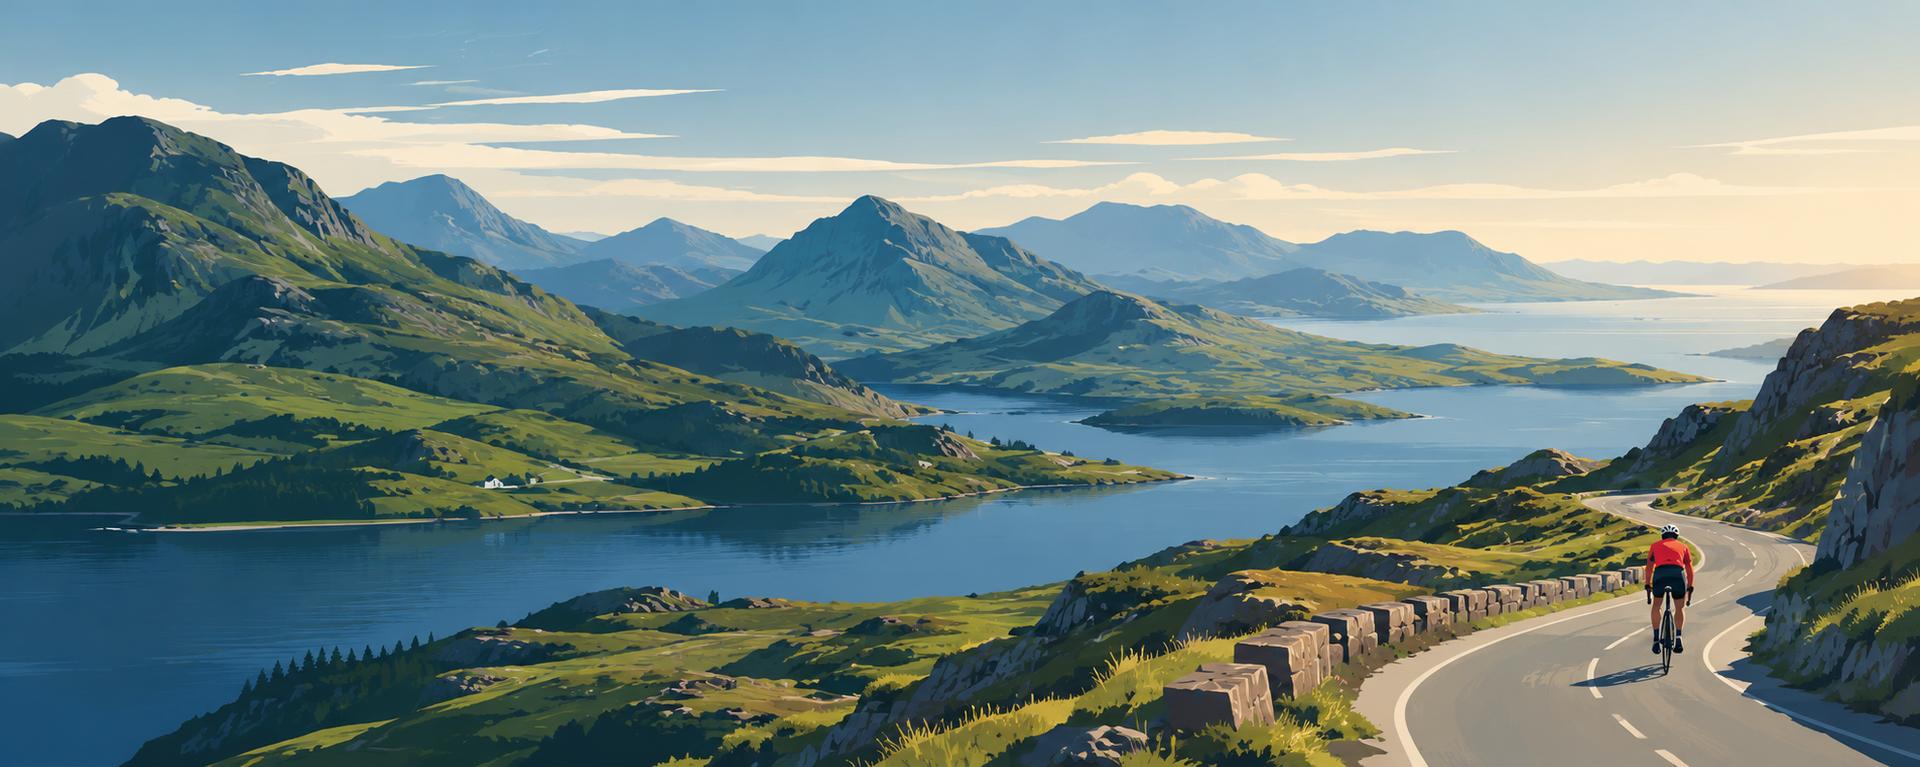
The climb · France
About Courchevel
Courchevel is Alpine elegance. The climb twists through pine forests, open meadows, and high slopes, offering varied gradients and constant visual reward. Hairpins come in predictable sequences, allowing rhythm while still demanding concentration.
The gradient is consistent, but there are sharper sections that punctuate the climb, forcing you to dig in. Alpine air cools the effort, making long sections sustainable yet testing.
At the summit, the view of the valley below and surrounding peaks is a perfect payoff. A climb for riders who enjoy a long, flowing Alpine ascent with character and style.
01 / The ascent
Elevation profile
02 / The crux
Where it gets difficult
Choose a distance to find the steepest continuous section of the climb.
Steepest 500 m average
9.5%
Where to find it
6.20–6.70 km from start
- Net height gained
- 47 m
- Section length
- 500 m
03 / The numbers
Climb statistics
- Distance
- 12.42 km
- Elevation gain
- 822 m
- Average gradient
- 6.6%
- Climb category
- HC
- Start elevation
- 914 m
- Summit elevation
- 1,731 m
04 / Your effort
How long would it take?
Enter the power you could hold for the whole climb. We calculate a moving time from the elevation profile and the forces you ride against.
Use your intended climbing effort, rather than FTP unless you can hold it for the predicted duration.
Bike + kit includes clothing, bottles and luggage.
Advanced settings
Defaults represent a road-bike scenario. Adjust these settings to match your tyres, drivetrain and riding position.
Modelled moving time
57 min
- Power throughout
- 225 W
- Average speed
- 13.0 km/h
Based on the 12.42 km elevation profile. Assumes steady power, with no stops, braking or drafting. Rounded to the nearest minute.
The science behind the calculation
For each part of the stored profile, we solve the steady-state cycling power equation for speed, then add distance ÷ speed across the climb. Gravity uses rider + equipment weight; available power is W/kg × rider weight. This uses the profile’s distance and elevation together, without mixing in another route’s metrics.
Power × efficiency = gravity + rolling resistance + air resistance + bearing losses
The resistance equations are adapted from Martin et al. (1998), Validation of a Mathematical Model for Road Cycling Power. Air density changes with profile altitude using NASA’s standard-atmosphere model. This calculator’s adaptation has not been independently validated.
It predicts travel at the power you enter, including on descents. It does not model acceleration, cornering, braking, traffic, wind, changing weather or fatigue. At altitude, choose power you can sustain there: thinner air reduces drag, but this model does not predict its effect on your ability to produce power. Profile quality and assumed equipment settings also affect the result.
05 / On the ground
Route map
Route overview
Courchevel
Saint Bon Tarentaise, Rhône-Alpes, France
- Route length
- 12.42 km
- Total ascent
- 822 m
- Average gradient
- 6.6%
06 / Take it home
The climb, as artwork
Turn the route into a personalised topographic print. Choose your colours and composition, then download your artwork.
07 / Keep exploring
Nearby climbs
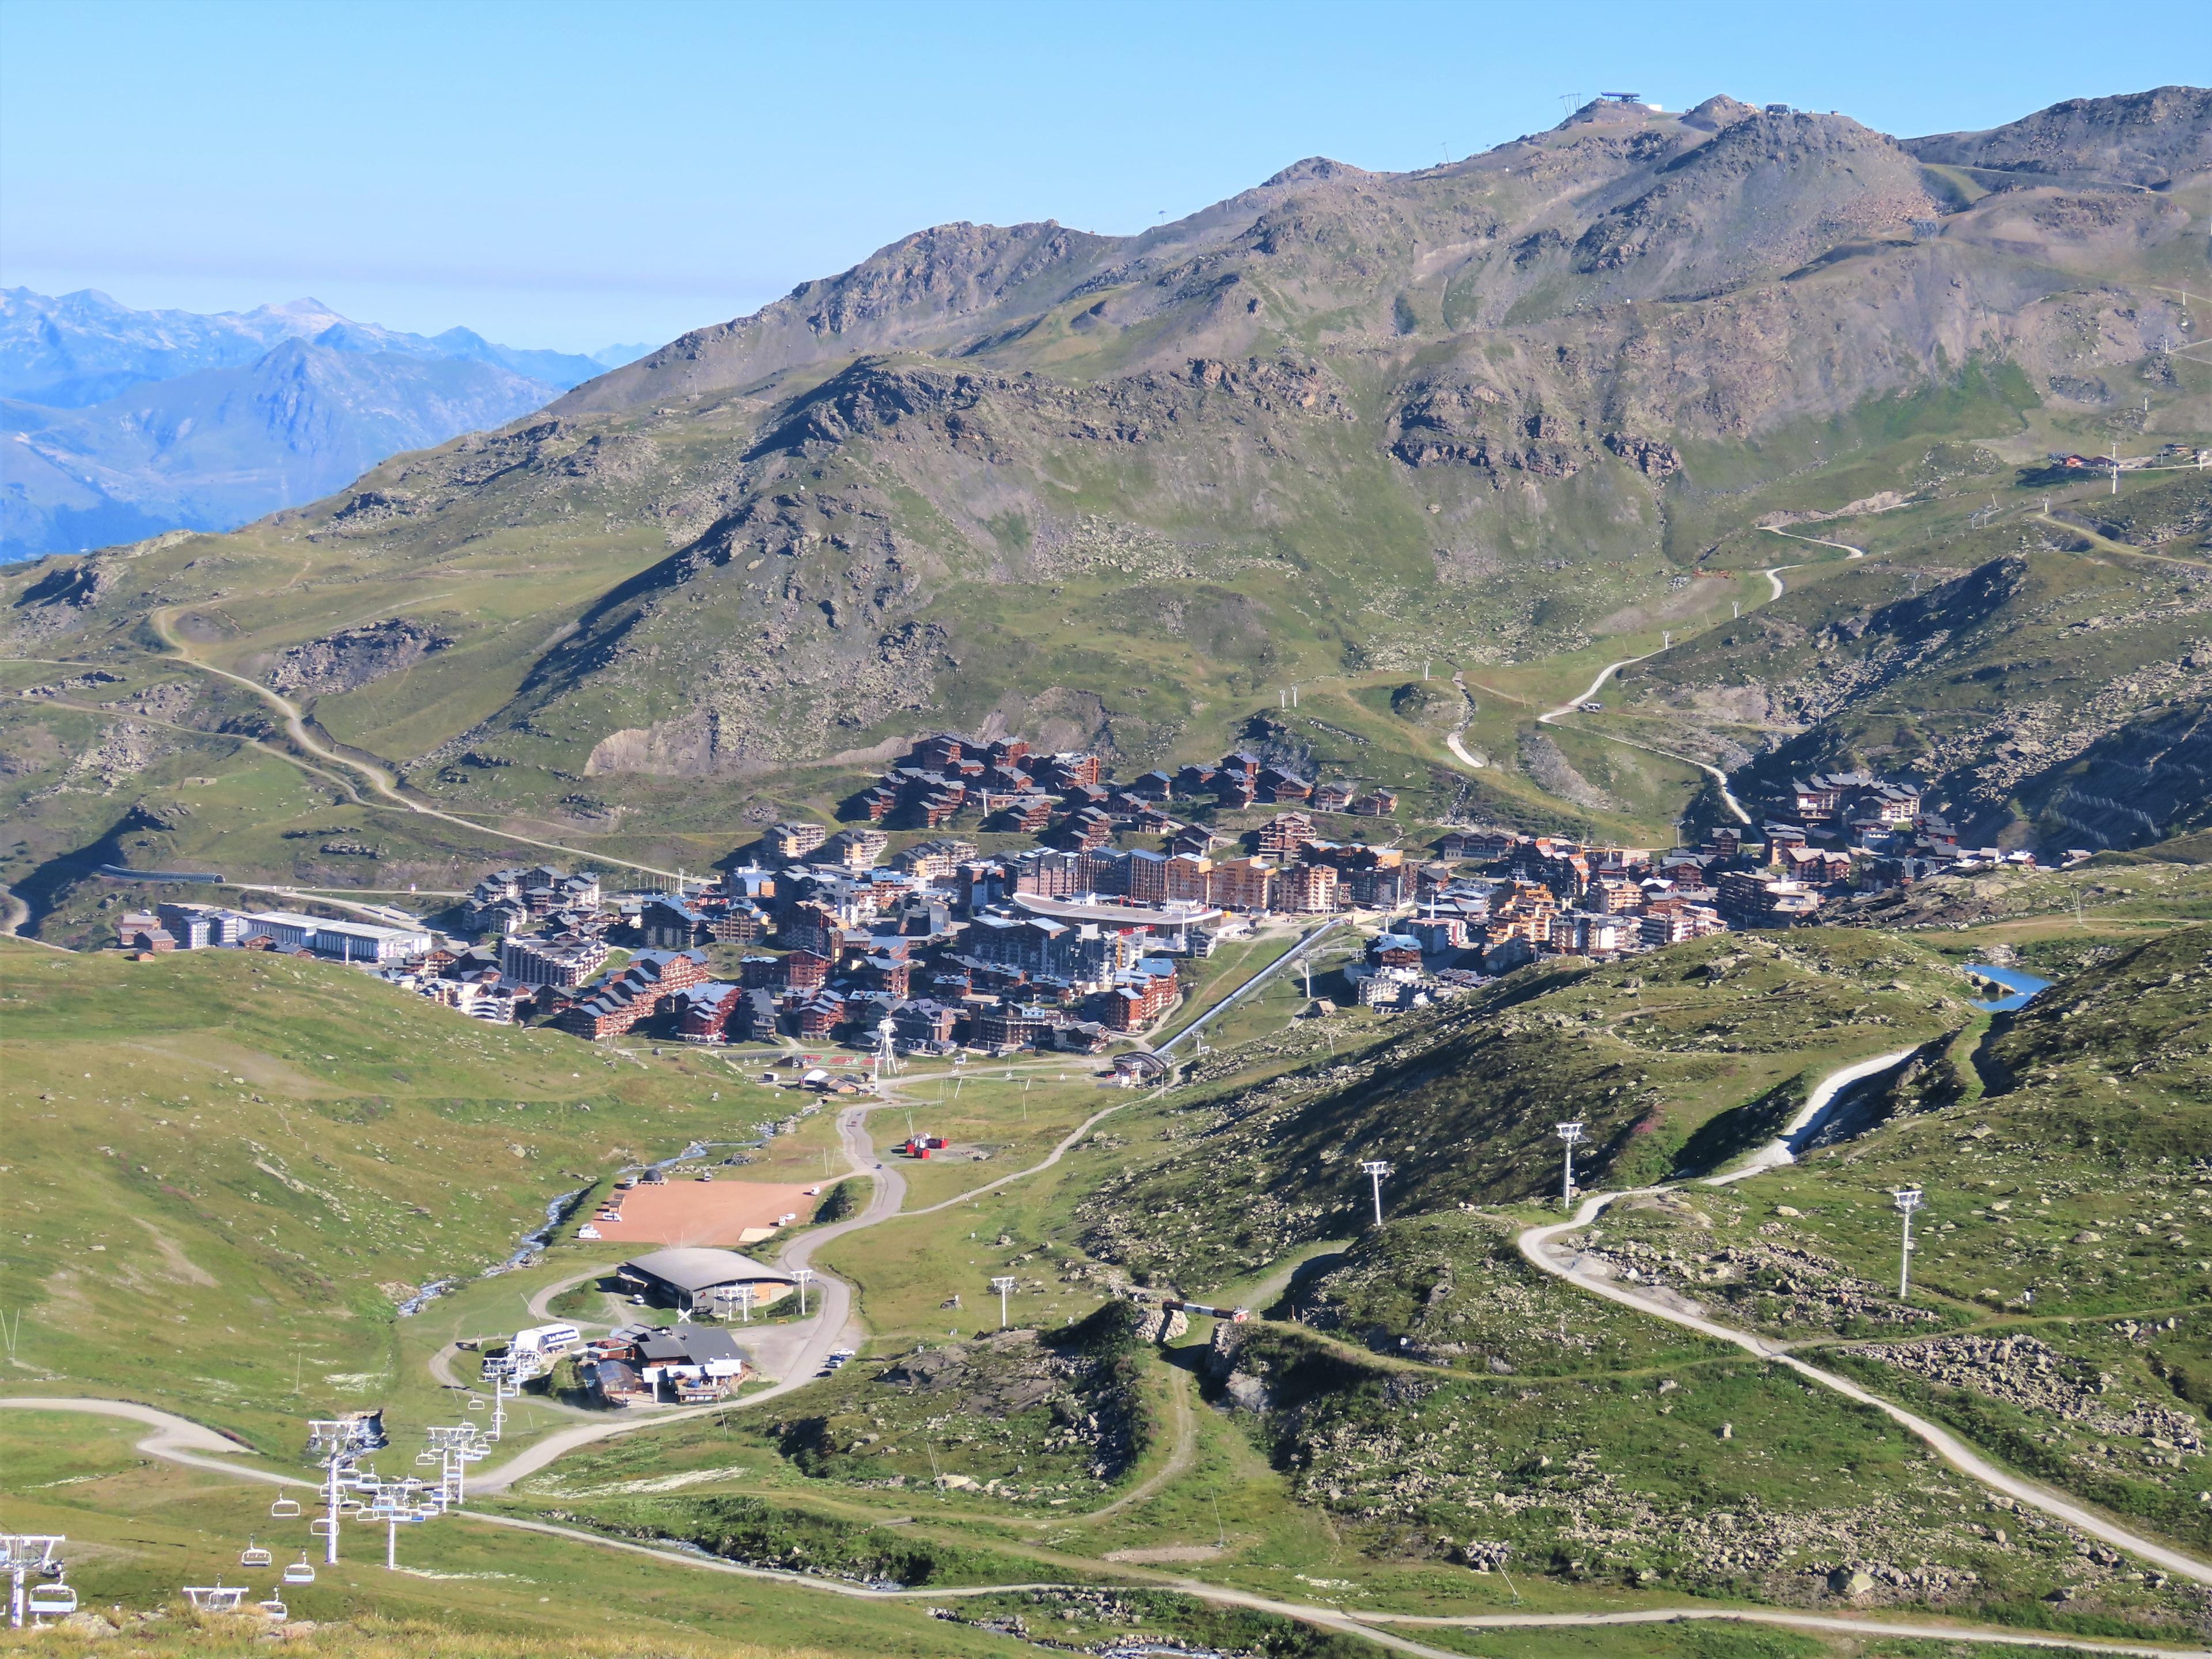
Val Thorens
36.3 km · 4.8% · 1899 m gain
Moûtiers, RA, France
8.6 km away · Explore climb →
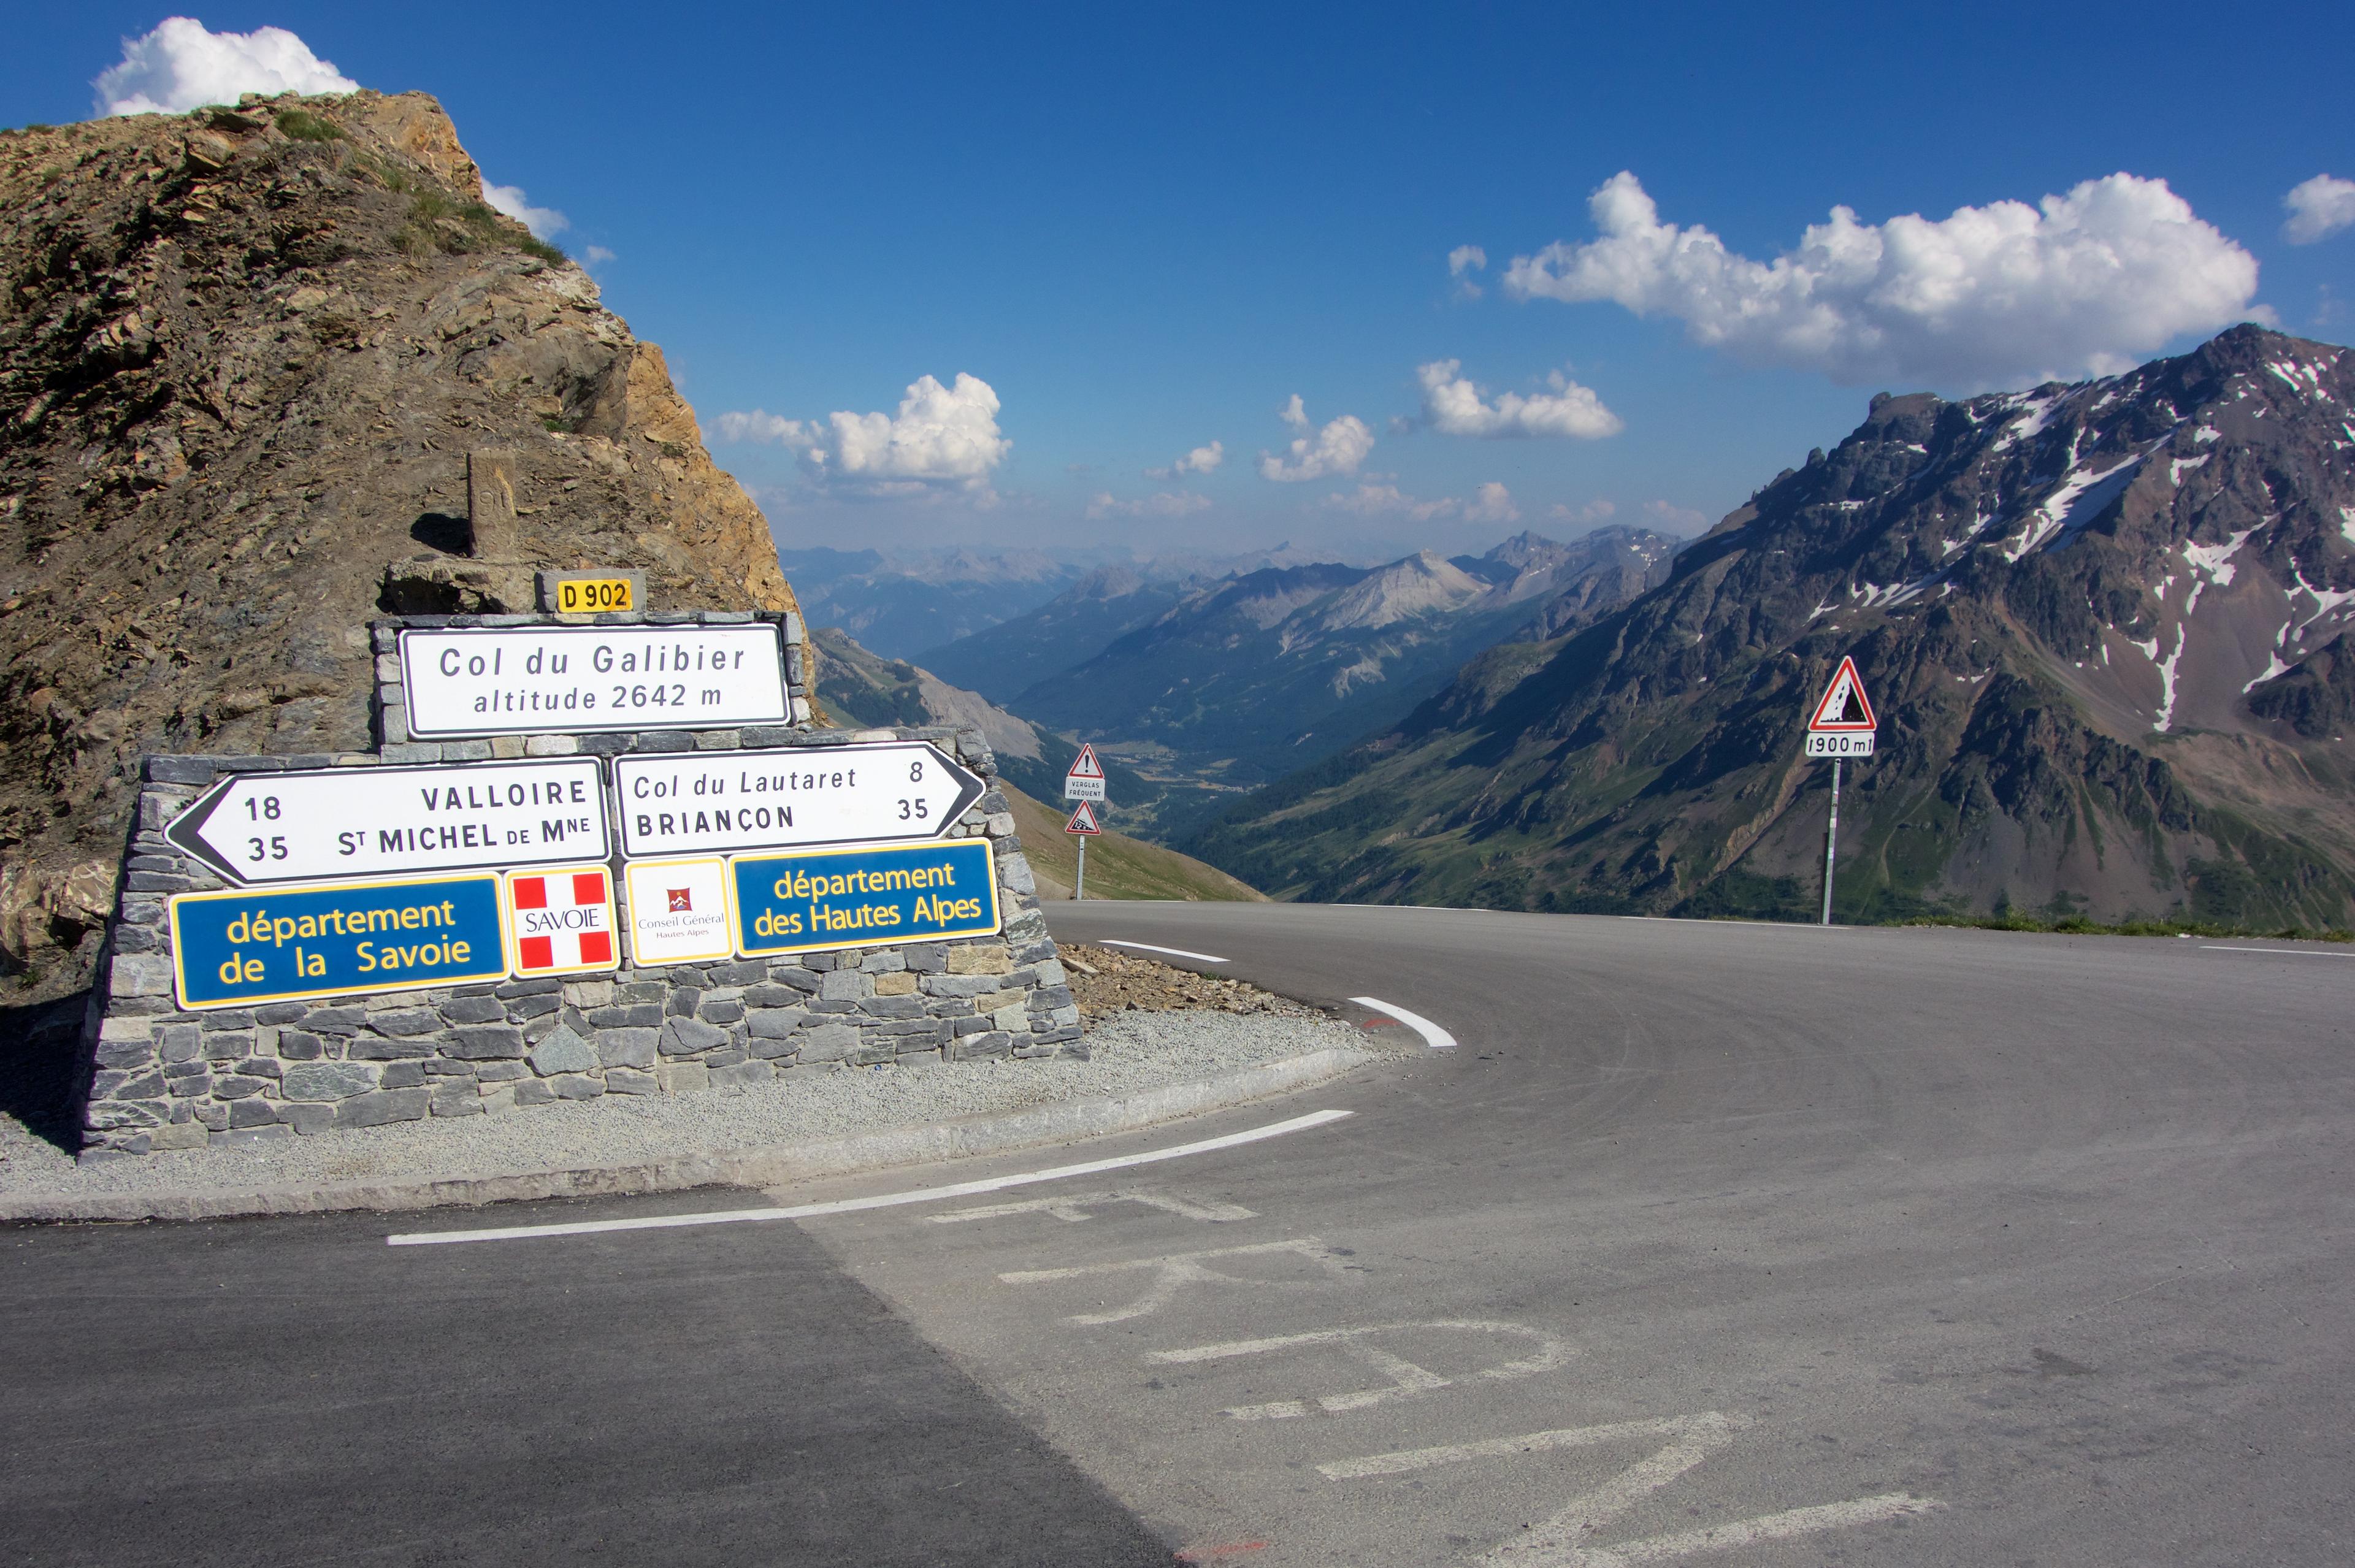
Col du Galibier
34.8 km · 6.4% · 2087 m gain
Saint-Michel-de-Maurienne, Savoy, France
27.6 km away · Explore climb →
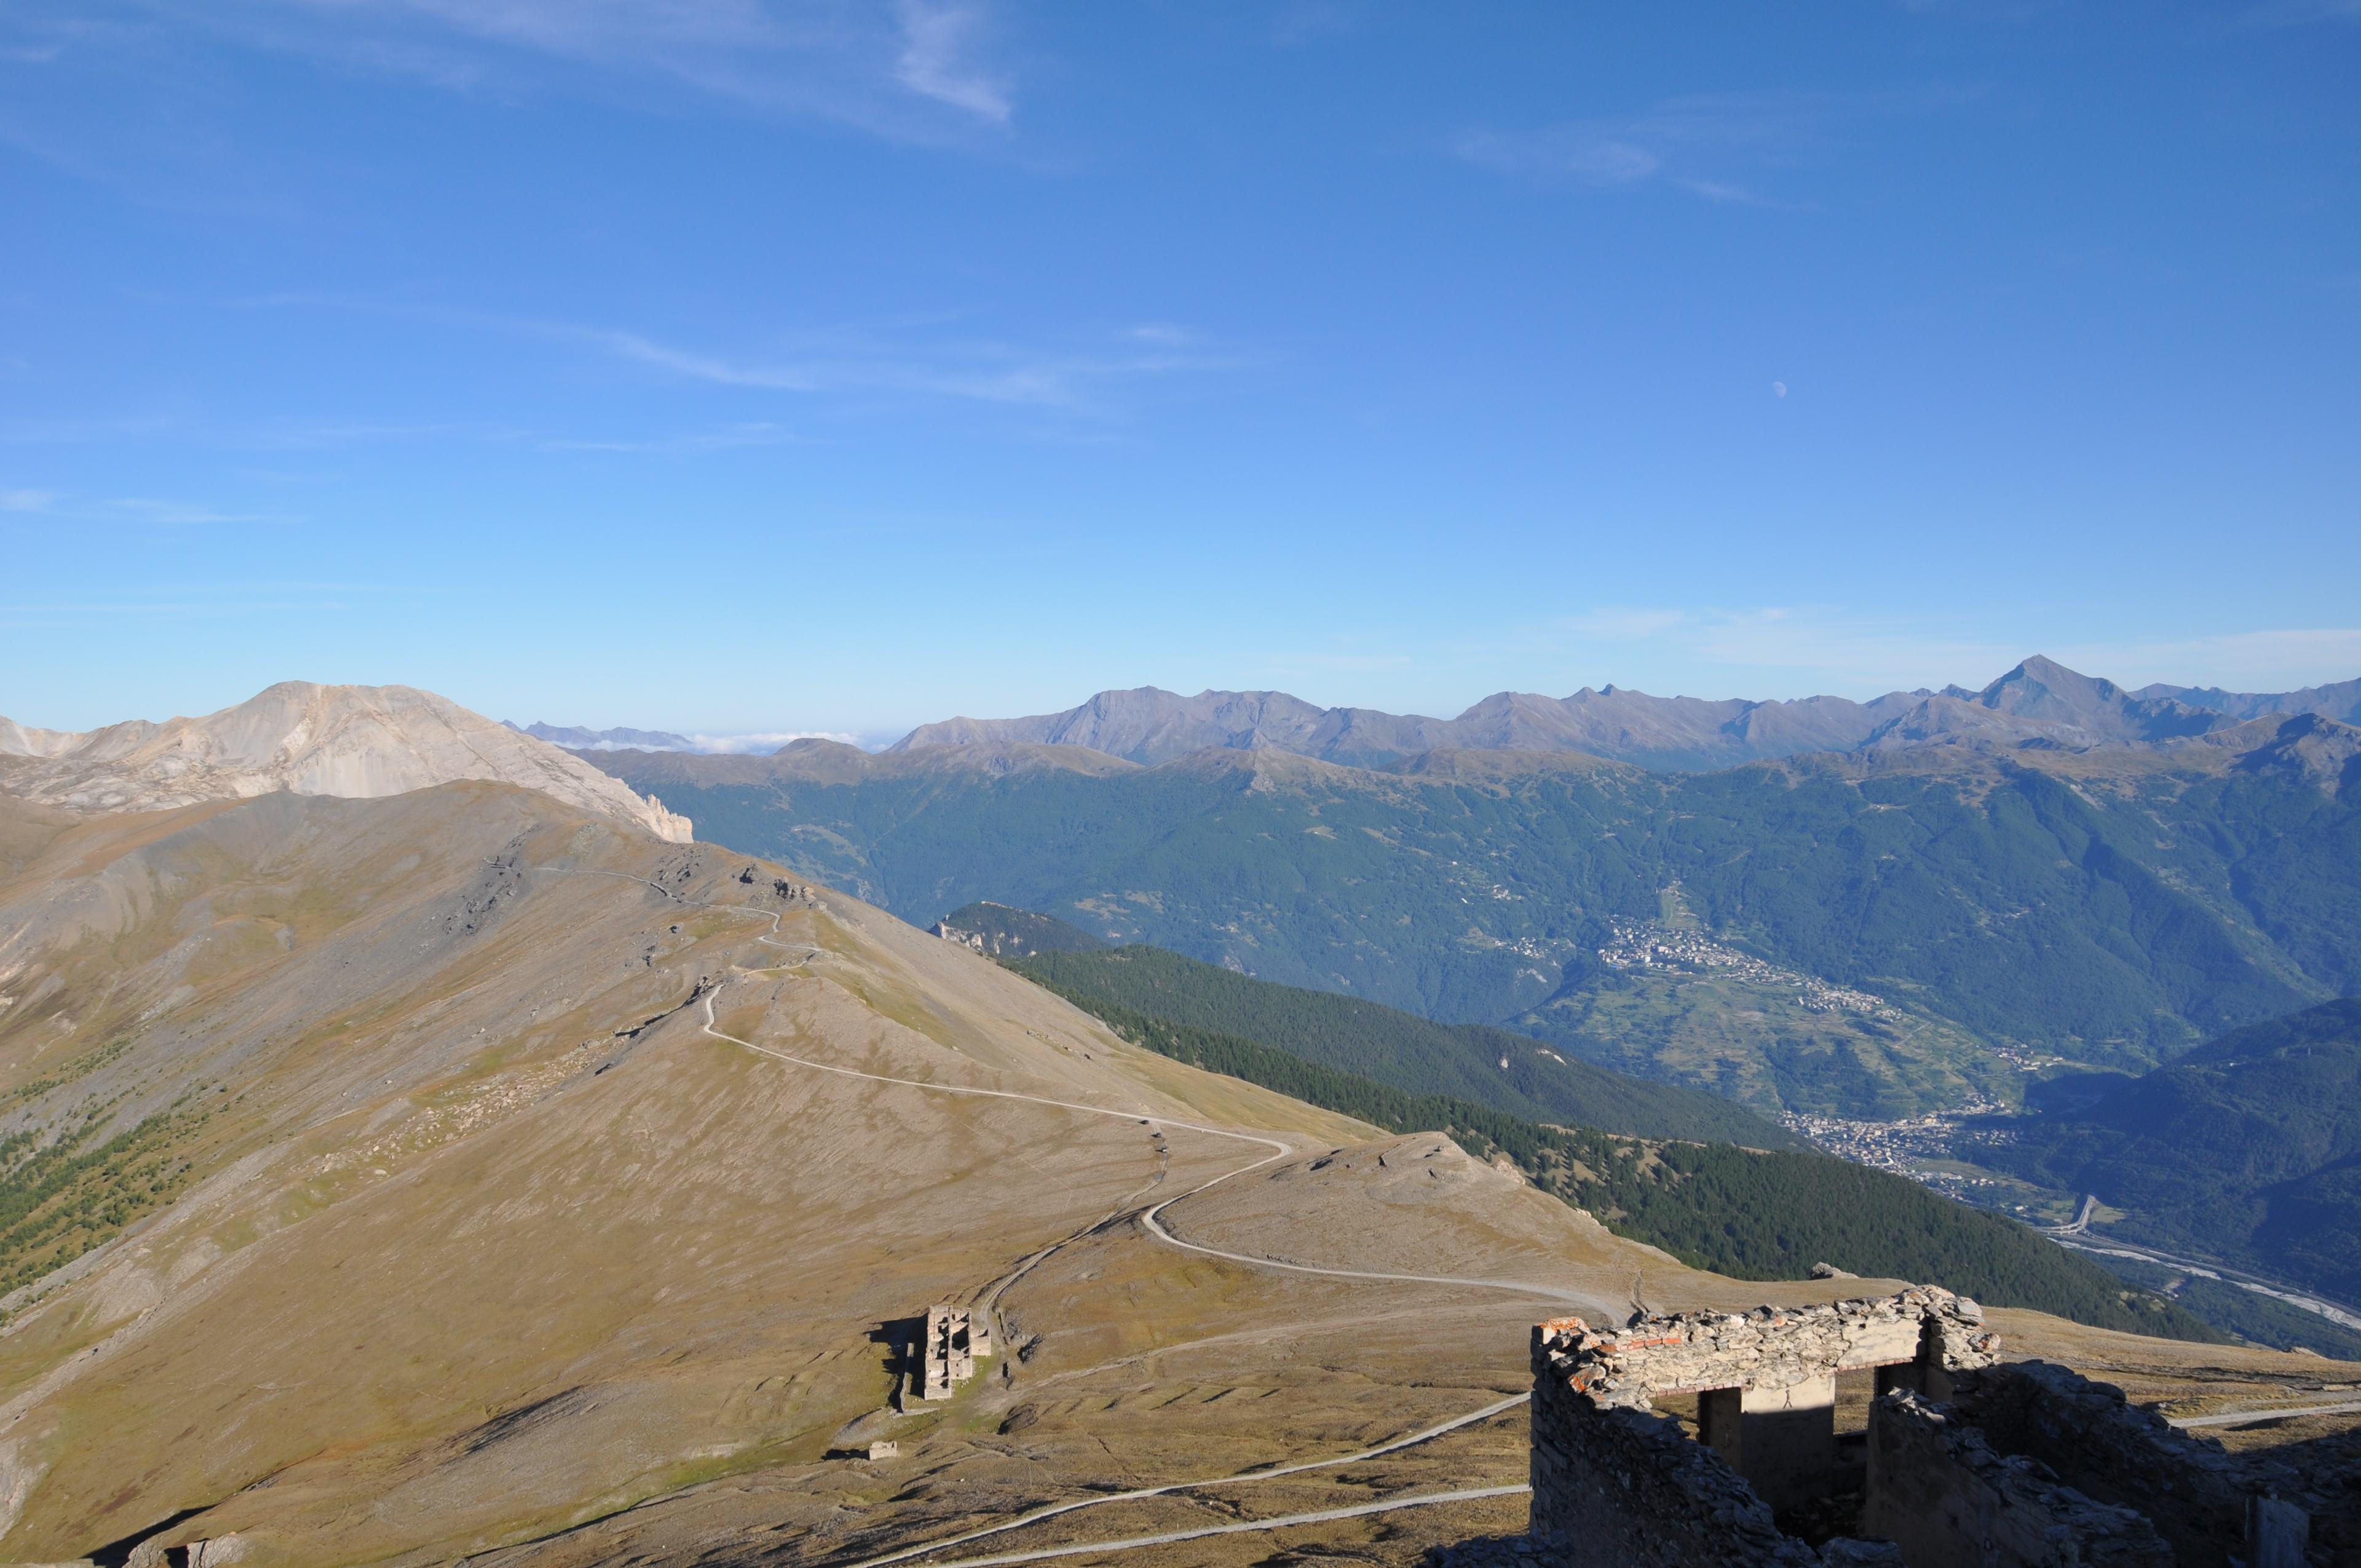
Monte Jafferau
7.3 km · 8.4% · 0 m gain
Piemonte, Italy
41.0 km away · Explore climb →
Col du Barioz
7.7 km · 6.5% · 504 m gain
Saint Pierre D'Allevard, Rhône-Alpes, France
45.1 km away · Explore climb →
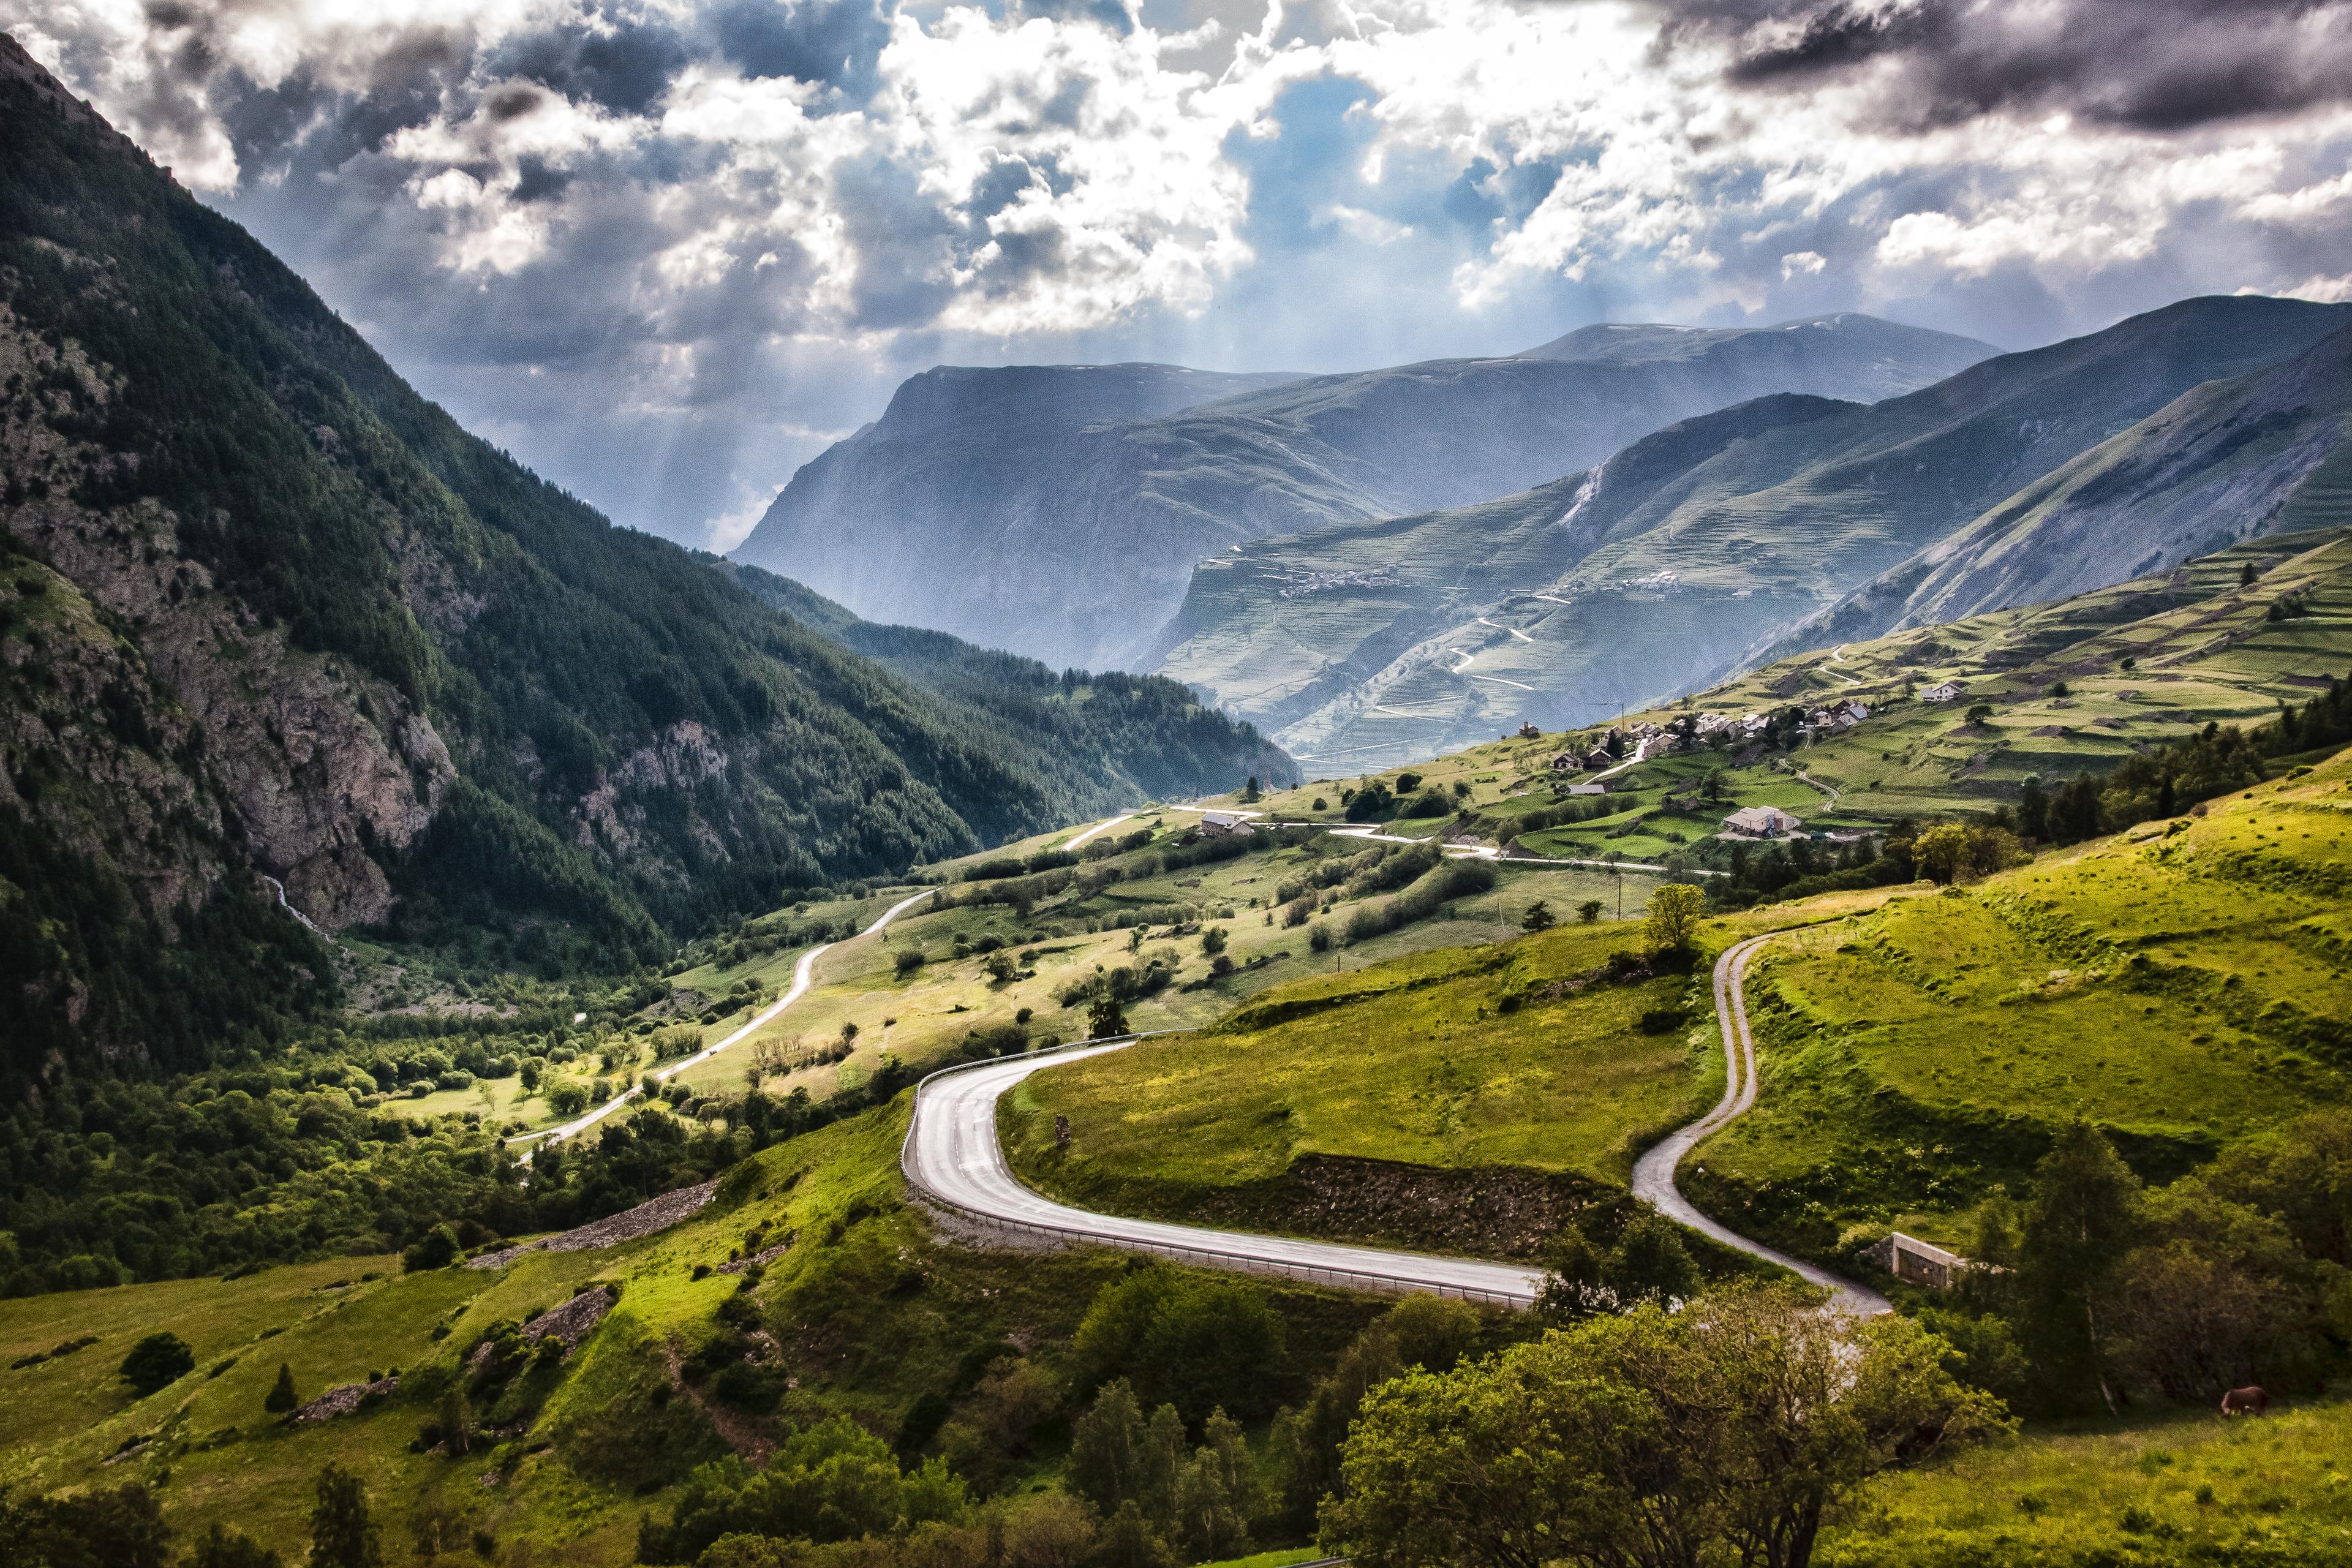
Col du Galibier from Villar-d’Arène
15.7 km · 6.1% · 960 m gain
Villar D'Arêne, PACA, France
49.5 km away · Explore climb →