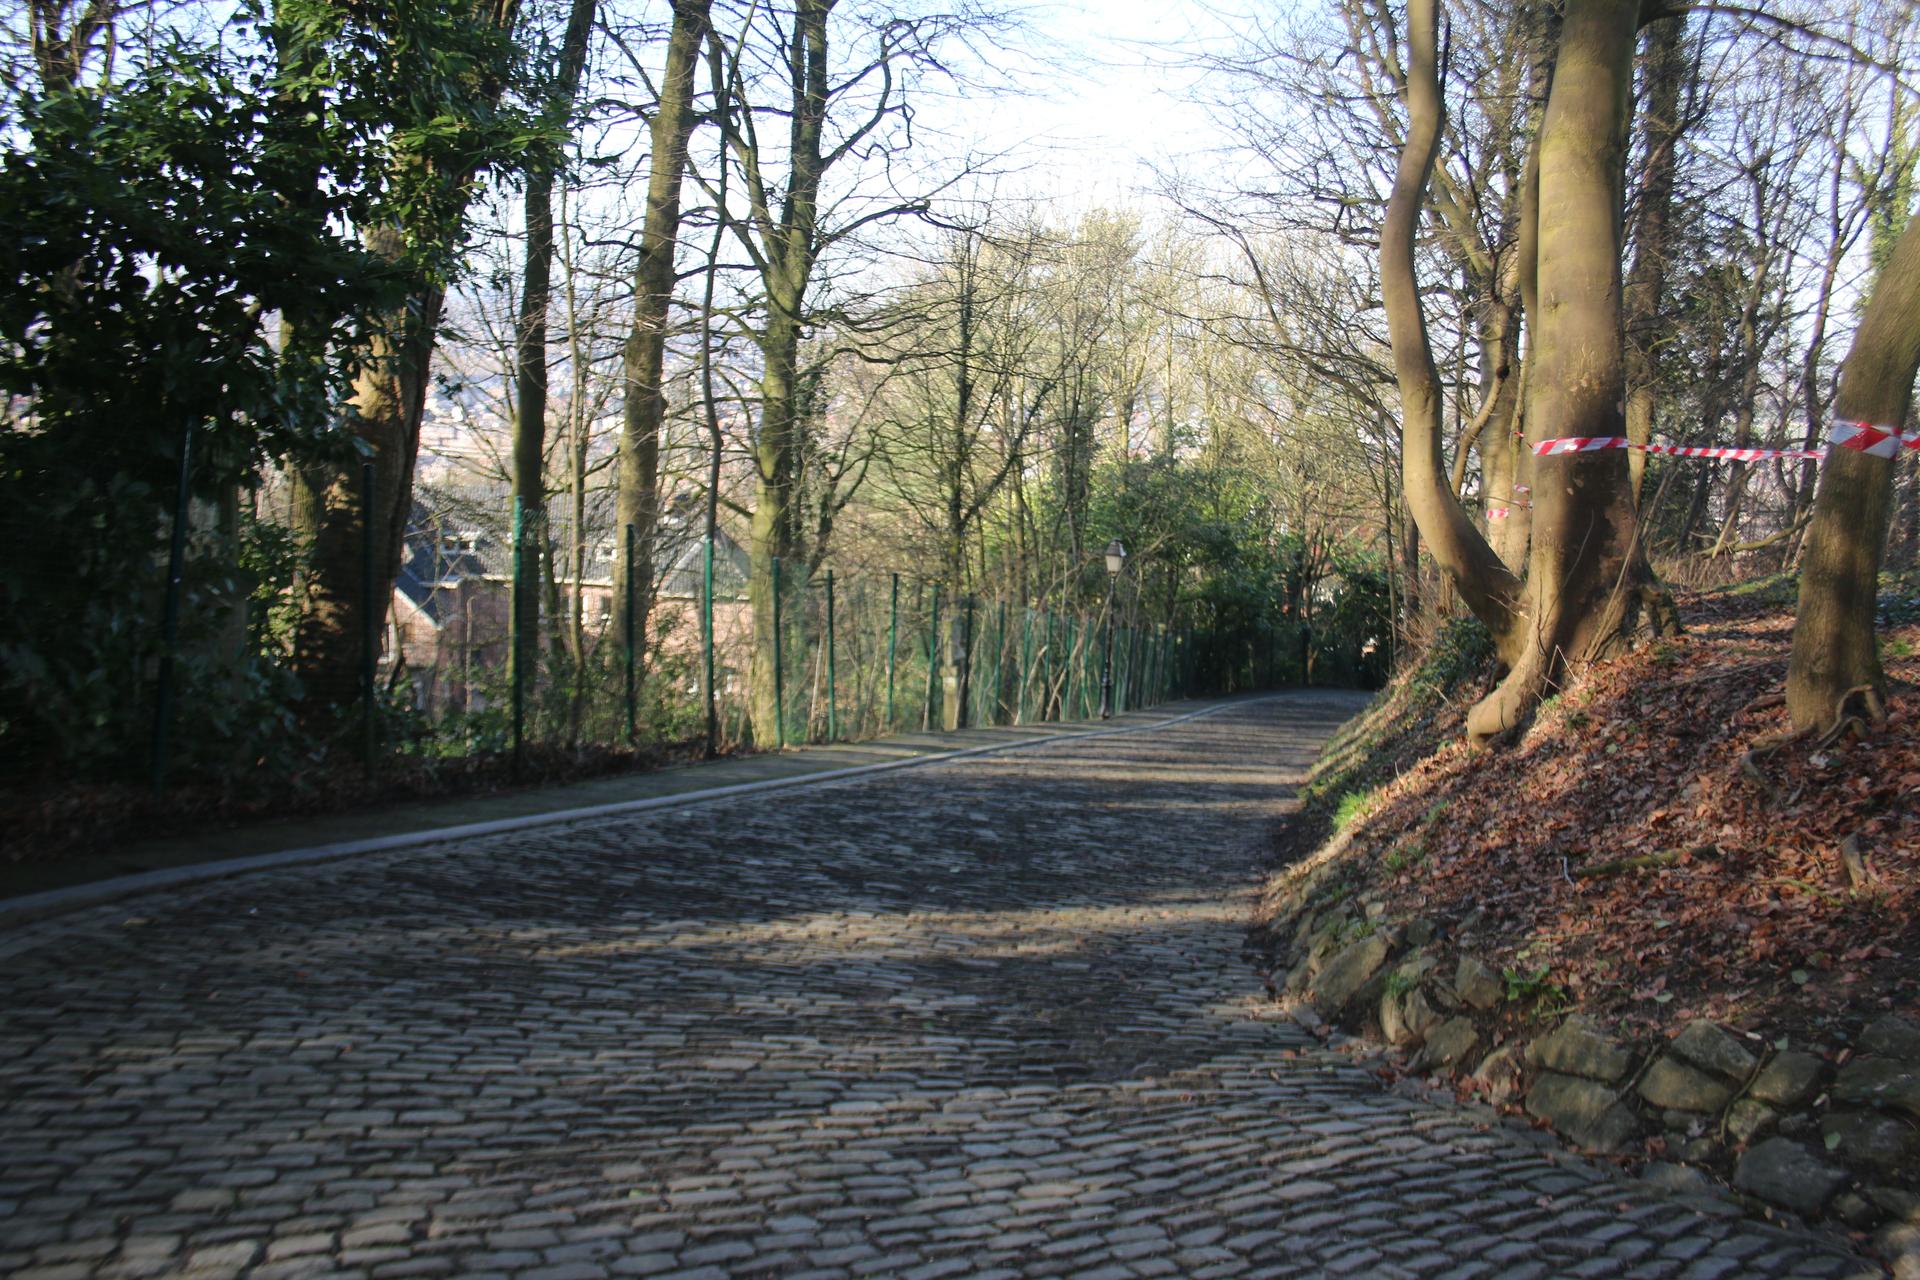
The Muur van Geraardsbergen carries the ride from the town towards the chapel on the Oudenberg. This selected approach begins below the Vesten, combining the urban lead-in with the cobbled upper ascent. The setting changes as height is gained: streets below give way to the steep road around the hill, and the chapel provides a clear destination above. The climb has several distinct pieces, so its full character is only apparent once the upper road is reached.
Over roughly 1.1 kilometres, the selected segment gains about 89 metres. The earlier climbing leaves room for a rhythm, but the upper cobbles tighten the relationship between effort, grip and direction. Turns break the ascent into shorter views, and the final approach to the chapel gives the work a tangible conclusion. It is this movement from town to hillside, as much as the steep paving, that makes the Muur such a complete little climb.
01 / The ascent
Elevation profile
02 / The numbers
Climb statistics
- Distance
- 1.10 km
- Elevation gain
- 89 m
- Average gradient
- 8.7%
- Climb category
- 4
- Start elevation
- 18 m
- Summit elevation
- 107 m
03 / Your effort
How long would it take?
Enter the power you could hold for the whole climb. We calculate a moving time from the elevation profile and the forces you ride against.
Use your intended climbing effort, rather than FTP unless you can hold it for the predicted duration.
Bike + kit includes clothing, bottles and luggage.
Advanced settings
Defaults represent a road-bike scenario. Adjust these settings to match your tyres, drivetrain and riding position.
Modelled moving time
6 min
- Power throughout
- 225 W
- Average speed
- 9.8 km/h
Based on the 1.00 km elevation profile. Assumes steady power, with no stops, braking or drafting. Rounded to the nearest minute.
The science behind the calculation
For each part of the stored profile, we solve the steady-state cycling power equation for speed, then add distance ÷ speed across the climb. Gravity uses rider + equipment weight; available power is W/kg × rider weight. This uses the profile’s distance and elevation together, without mixing in another route’s metrics.
Power × efficiency = gravity + rolling resistance + air resistance + bearing losses
The resistance equations are adapted from Martin et al. (1998), Validation of a Mathematical Model for Road Cycling Power. Air density changes with profile altitude using NASA’s standard-atmosphere model. This calculator’s adaptation has not been independently validated.
It predicts travel at the power you enter, including on descents. It does not model acceleration, cornering, braking, traffic, wind, changing weather or fatigue. At altitude, choose power you can sustain there: thinner air reduces drag, but this model does not predict its effect on your ability to produce power. Profile quality and assumed equipment settings also affect the result.
04 / On the ground
Route map
Route overview
Muur van Geraardsbergen
Geraardsbergen, Vlaams Gewest, Belgium
- Route length
- 1.10 km
- Total ascent
- 89 m
- Average gradient
- 8.7%
05 / Take it home
The climb, as artwork
Turn the route into a personalised topographic print. Choose your colours and composition, then download your artwork.
06 / Keep exploring
Nearby climbs

Bosberg
1.4 km · 5.0% · 68 m gain
Geraardsbergen, Vlaanderen, Belgium
2.9 km away · Explore climb →
Rue de Lessines
0.7 km · 6.2% · 46 m gain
Lessines, Walloon Region, Belgium
6.8 km away · Explore climb →
Vijverdal
0.3 km · 4.6% · 17 m gain
Lierde, Vlaanderen, Belgium
7.4 km away · Explore climb →

Berendries
1.0 km · 6.5% · 62 m gain
Brakel, Vlaanderen, Belgium
10.4 km away · Explore climb →
Les Plachettes
1.0 km · 6.1% · 64 m gain
Flobecq, Région Wallonne, Belgium
10.7 km away · Explore climb →